How we measure.
Every number Retrics publishes links to this page. It exists so that a founder can read the method in plain language and an analyst can check it — the backtest design, the natural-return floor, the holdout at send time, and exactly what our figures mean and don't mean.
The backtest: predictions graded by history
Before Retrics claims its models work, it has to prove they would have worked — on data where the answer is already known. A backtest is that dress rehearsal. We take twelve months of real Shopify order history, freeze the model at a cutoff date partway through, and let it make its predictions using only what it could have seen on that day: which customers were entering their reorder window, which first-time buyers were inside their second-order window, who was drifting past her own cadence.
Then we roll the clock forward and grade the predictions against the orders that really followed, over a fixed horizon. The model never sees the future it is graded on; every prediction is scored “as-of” the day it was made. This is how the 3.2× second-order finding was produced: customers the model placed inside their predicted second-order window went on to place that second order at 3.2× the rate of comparable customers outside it.
A backtest is strong evidence for a predictive claim — the window exists and the model finds it. It is deliberately not evidence for a causal claim — that a message sent inside the window makes the order happen. That distinction runs through everything below.
The natural-return floor
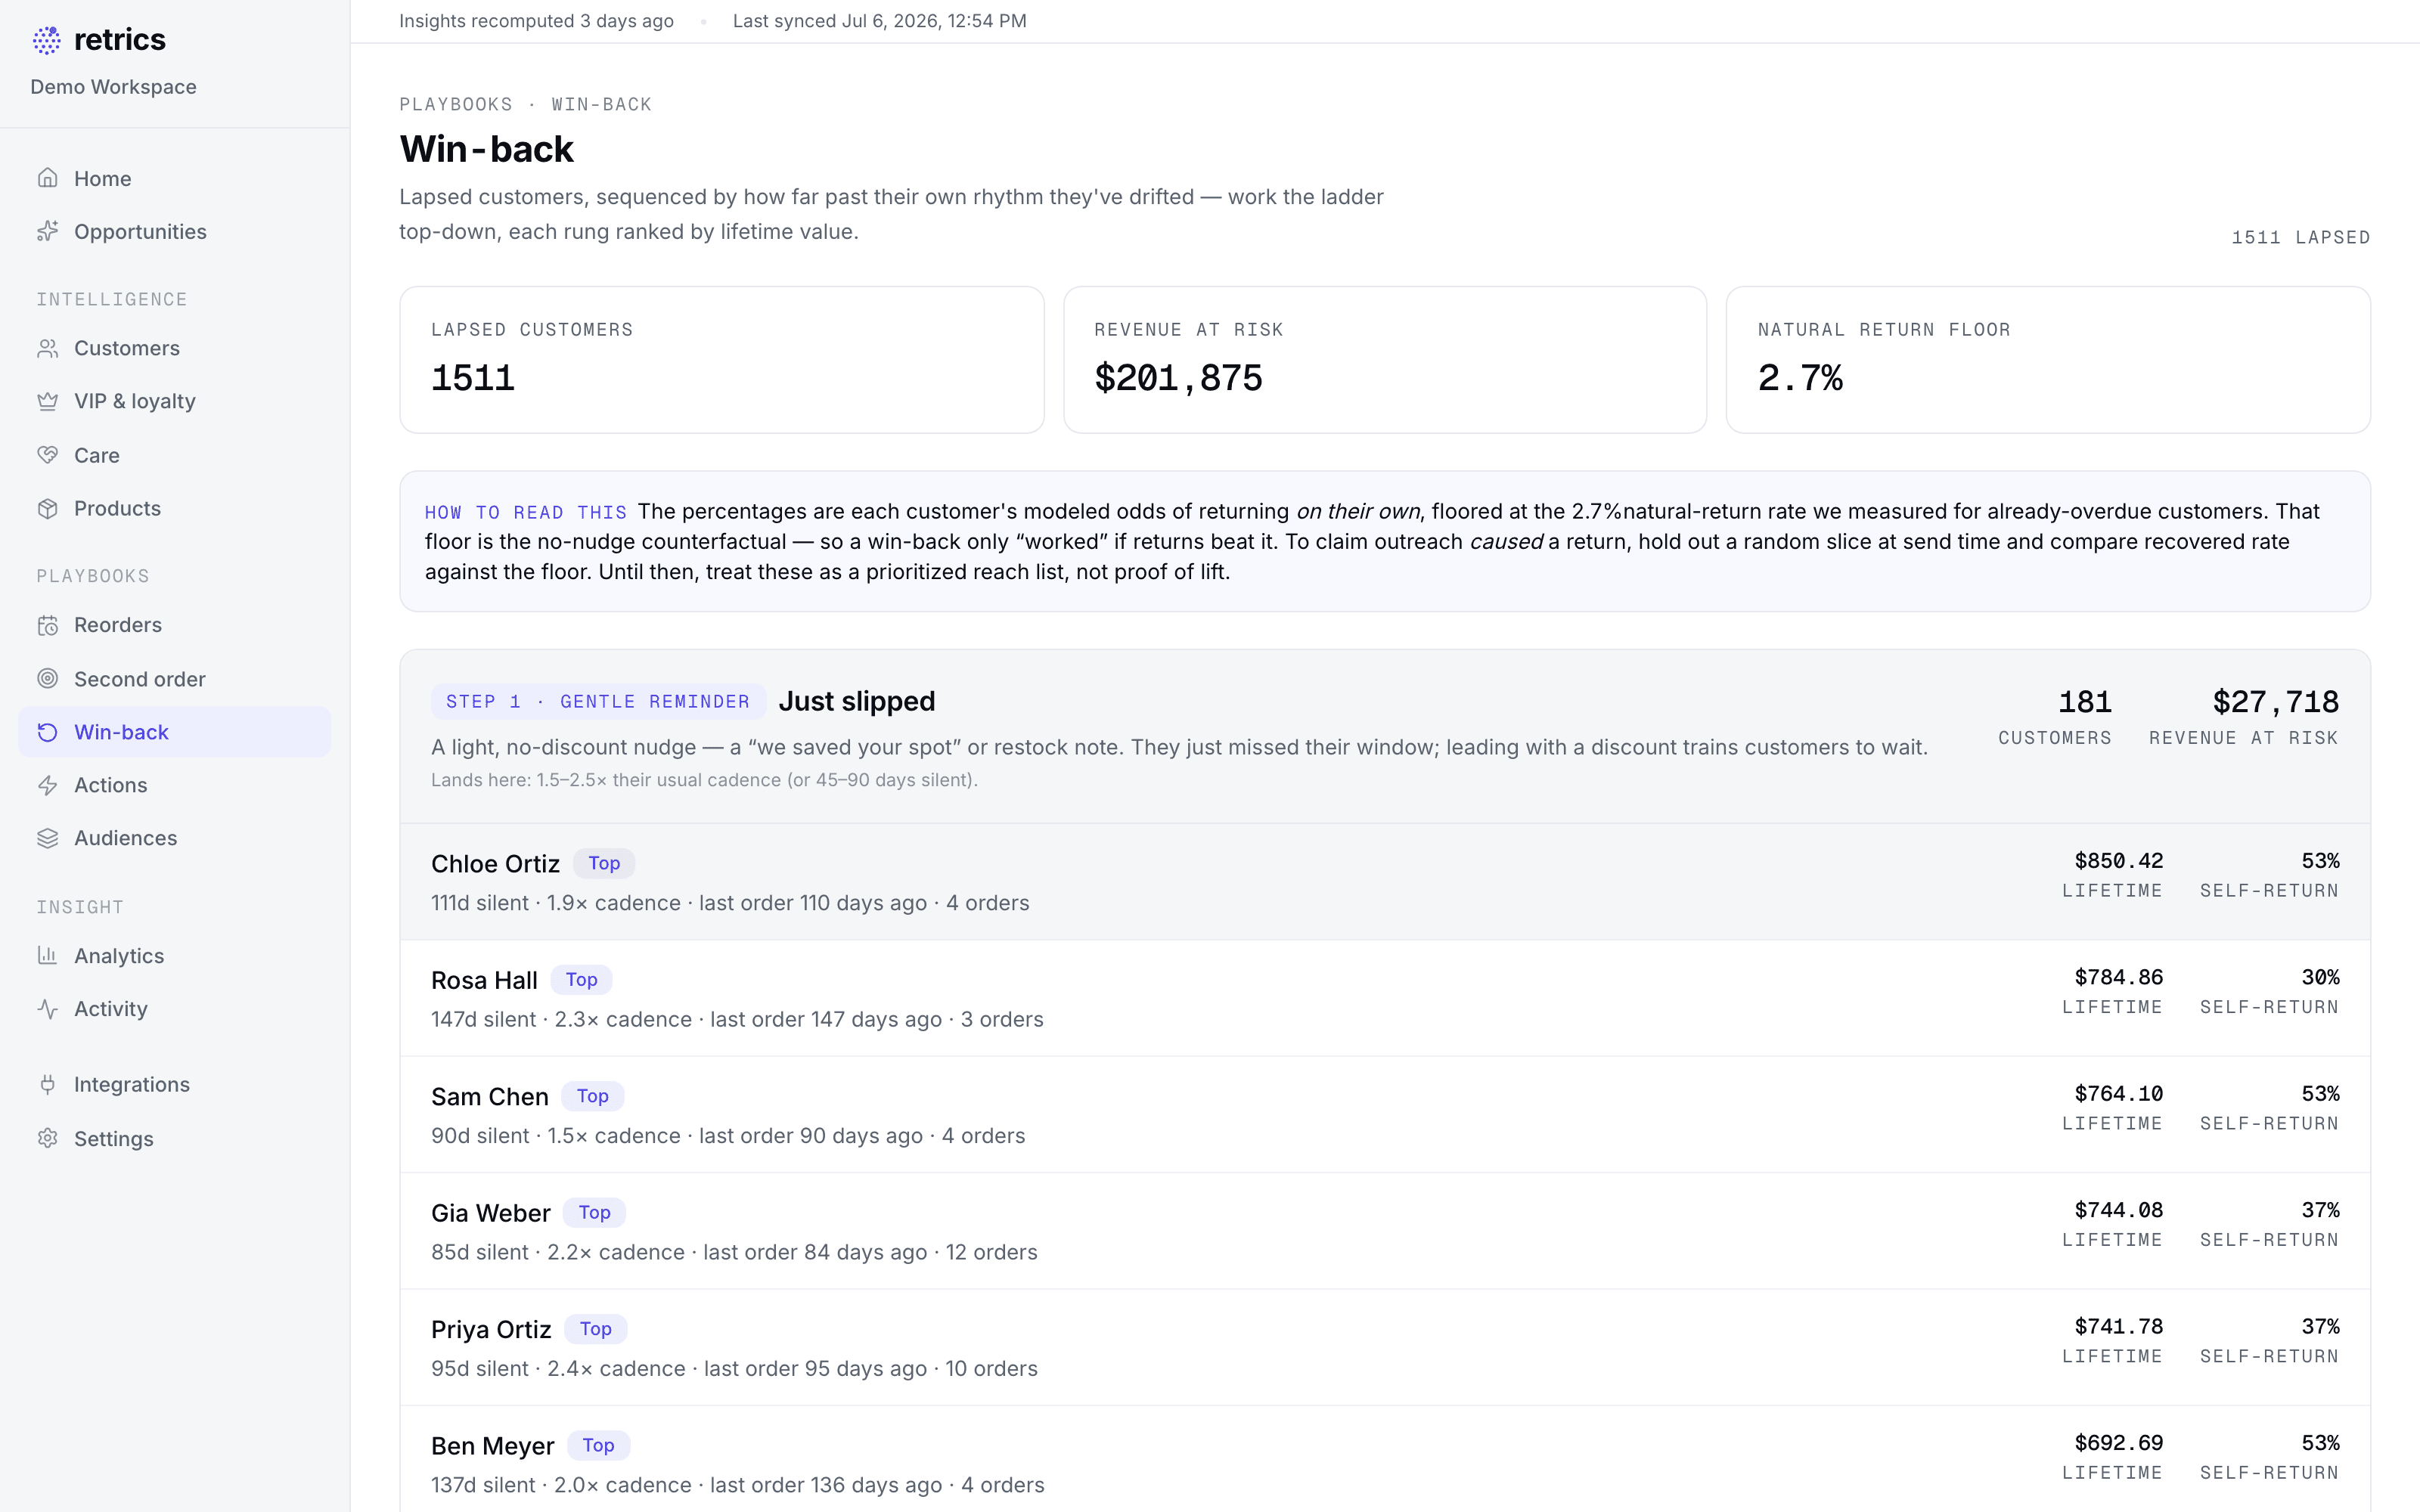
Some lapsed customers come back on their own. No email, no nudge, no discount — the jar runs out, they remember you, they reorder. In our backtest data, that happens for about ~2.7% of lapsed customers over the measurement horizon. We call that the natural-return floor.
The floor is the single most important honesty device in Retrics. Any tool that messages lapsed customers will see some of them return and will be tempted to take the credit — but the floor's worth of returns was arriving anyway. So before Retrics counts a recovered dollar, the floor is subtracted. What remains is the part the intervention can plausibly claim; the rest belonged to your brand all along.
You can see the floor at work inside the product: the win-back ladder shows each lapsed group's odds of returning on their own, right next to the case for reaching out.
Holdout measurement at send time
Once your store is live and you approve a win-back, the honest question changes from “can the model predict?” to “did the message cause the return?” The only clean answer is a control group: a randomly selected slice of the eligible customers is held out and not contacted. They are the counterfactual — the version of events where you did nothing.
Recovered revenue is then the difference between the contacted group and what the holdout says would have happened anyway:
recovered revenue = revenue from contacted customers
− expected revenue without contact
where “expected without contact” comes from the holdout,
or from the natural-return floor before a holdout matures
Every figure in the ledger is labeled with which of the two it is. Holdout-verified means a control group existed and the difference is causal evidence. Observational means no control was available — the floor was subtracted, but the residual could still contain returns that weren't earned. Observational numbers are honest starting points, never proof, and the product says so on the page where they appear.
This is also why the drafts wait for you. Anything shown in violet was written by the AI, and nothing sends until you approve it — which means every measured send is one a merchant actually chose to make.
A worked example
The arithmetic, end to end. The figures below are round numbers invented for clarity — an illustrative example, not customer results.
A last-touch, platform-attributed report would claim all 41 returns — $2,378. The ledger records $812, because 27 of those customers were statistically on their way back regardless. Smaller number, defensible in a board meeting.
What our numbers mean — and don't
They mean:the stated measurement was actually run. A backtest label means the prediction was scored against held-out history. A holdout label means a control group existed at send time. “Demo store data” under a screenshot means the interface is real and the data behind it is our seeded demo store.
They don't mean: your store will see the same figures. Backtest results describe the order history they were computed on; your cadences, catalog, and customers differ. That is why the trial replays your own twelve months rather than quoting ours — and why nothing on this site is presented as a guarantee of outcome.
We contrast this with a practice common in the category: “platform-attributed revenue,” where a tool credits itself with every order that follows any touch it sent, with no control and no floor. Those numbers are always larger than ours. They are also not measurements — they are invoices the software writes to itself.
Definitions of the headline metrics
- Reorder window
- The span of days in which a specific customer, given her own purchase rhythm, is most likely to place her next order. Computed per customer from her order history — never a segment average.
- Second-order window
- The reorder window between a customer's first and second purchase — the interval in which first-time buyers are most likely to become repeat customers, and the subject of our backtest.
- Second-order window lift
- The ratio of second-order conversion for customers reached inside their predicted window versus comparable customers outside it. Our backtest measured 3.2×. (12-month backtest of real Shopify orders, holdout-scored)
- Natural-return floor
- The share of lapsed customers who return with no outreach at all — about ~2.7% in our backtest data. Always subtracted before recovered revenue is claimed.
- Holdout
- A randomly selected group of eligible customers that is deliberately not contacted. Their behavior measures what would have happened anyway; only the difference against them is credited.
- Recovered revenue
- Revenue from customers Retrics flagged and you approved outreach to, minus the revenue the holdout (or the floor, before a holdout matures) says would have arrived on its own.
- Return probability
- A per-customer estimate of the chance she orders again within a defined horizon, recomputed as orders land. It is a model output and is always labeled as such in the product.
Changelog of the method
Honesty means the method is allowed to improve in public. Every revision to how we measure is recorded here, versioned, with what changed and why.
First public version: the 12-month backtest design, the ~2.7% natural-return floor, and the send-time holdout ledger. Published before our first merchant cohort — the backtest is the only source of results on this site today, and this page will say so until that changes.